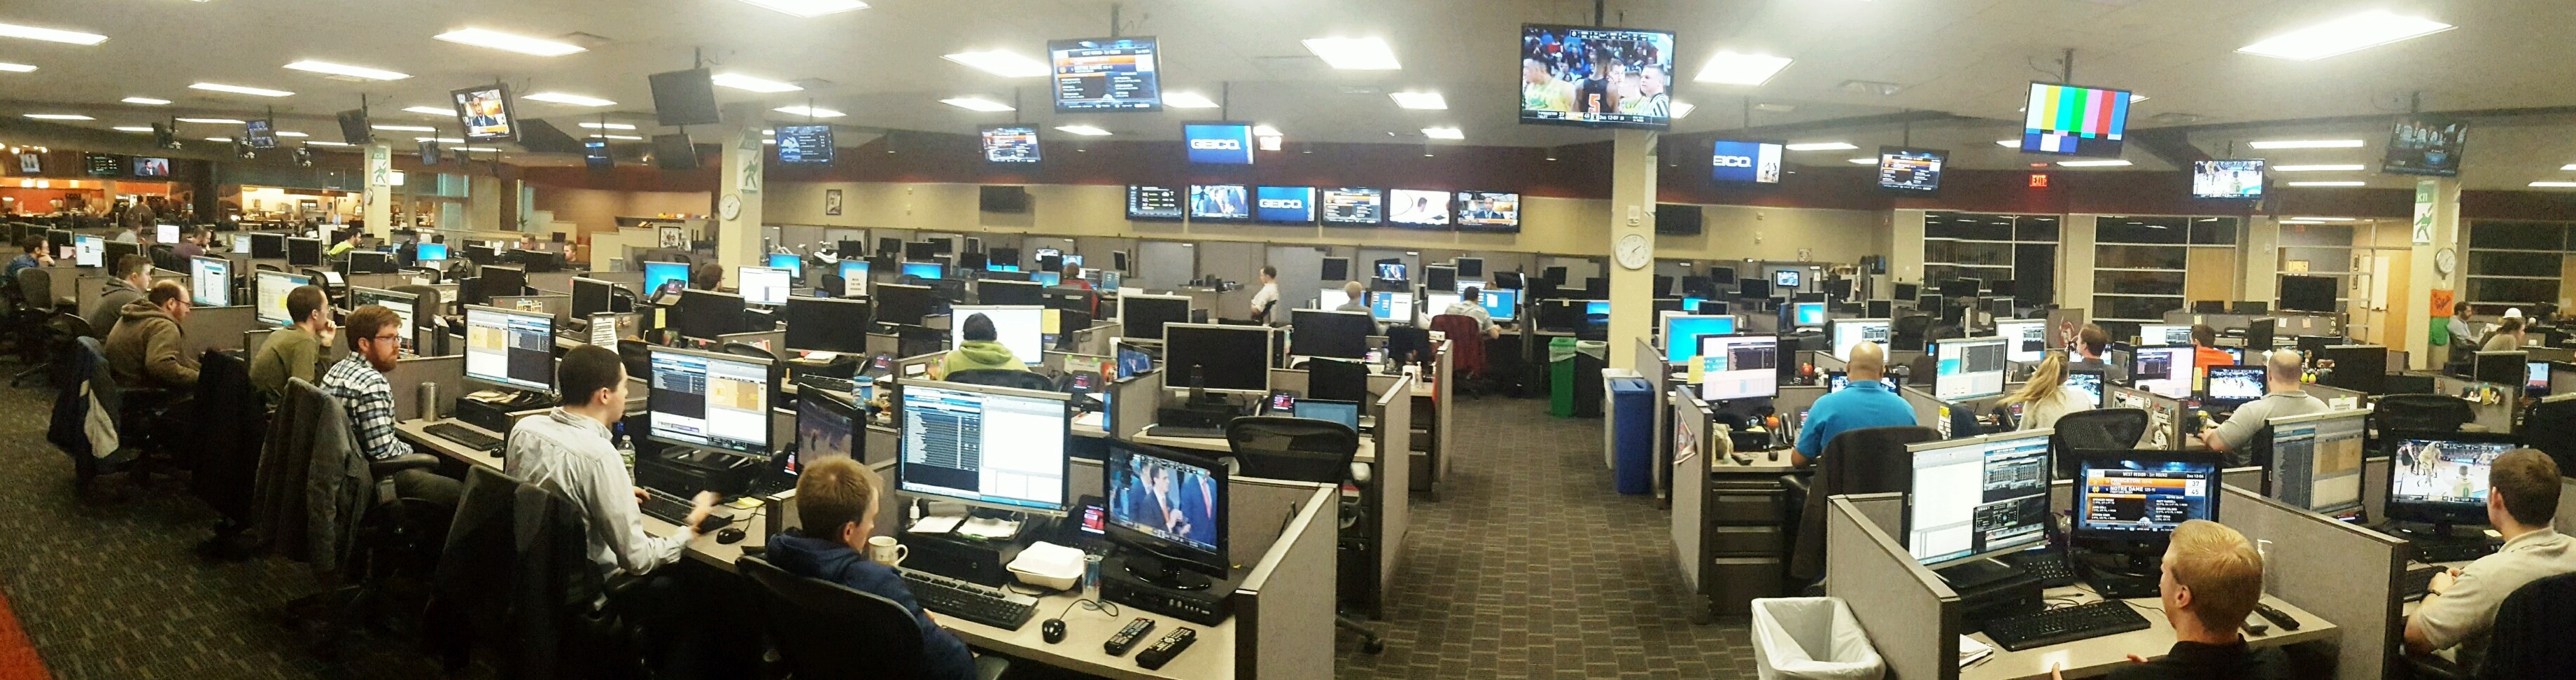
As great as the NCAA Men’s and Women’s basketball Tournaments are for fans, the first weekend of the annual event is maybe most enjoyable for people who work in ESPN’s Stats and Information Group (SIG).
In the weeks leading up to the tournament, production researchers put together full historical databases with every game, player and stat in NCAA history to use for reference throughout the tournament.
Once the tournament begins, stats analysts make sure that everything from team rosters to stations airing the games are correct and ready to go.
Once the games begin, stats analysts produce and/or manage the data for every game to populate box scores, shot charts and other outputs that appear all over ESPN’s platforms. SIG’s College Basketball Video Analysis team tracks the game looking for next-level insights, like how well teams play when faced with presses, touches in the paint and number of zone plays run. Stats analysts translate these data points into storylines and trends that summarize how they affected the direction and outcome of the game.
Once games are complete, other stats analysts “scrub” the box scores against data from the game site to ensure the accuracy of every stat. If inaccuracies are found, they work to rectify them by discussing the details with schools, teams, or conferences on what needs to be corrected.
The stats and storylines produced about these games are continuously generated throughout the entire game in an ongoing Slack chat with stats experts, researchers, talent and just about anyone at ESPN who might have use the information. Within that chat, questions are answered and historical research (like “second-most in NCAA history”) is added to the data to put it into perspective and make it even more useful for fans.
With this information, a collective postgame packet is sent out to provide summary content and statistics for our internal ESPN clients to aid in their efforts. These stats also power game recaps, overall daily recaps and eventually tournament summaries.
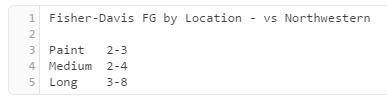
Below are examples of stats generated and distributed during and after Northwestern’s upset win over Vanderbilt last Thursday:
Stats tracked during the game via internal software
Game-winning shot update distributed to fans in real-time via ESPN’s BottomLine
![]()
![]()
Player graphic distributed to fans via 7 p.m. ET SportsCenter
Infographic distributed to fans via social media
In its NCAA Tournament debut, Northwestern edges Vanderbilt
Game featured 6 lead changes in last 96 seconds pic.twitter.com/ylIKueWeeI
— ESPN Stats & Info (@ESPNStatsInfo) March 16, 2017