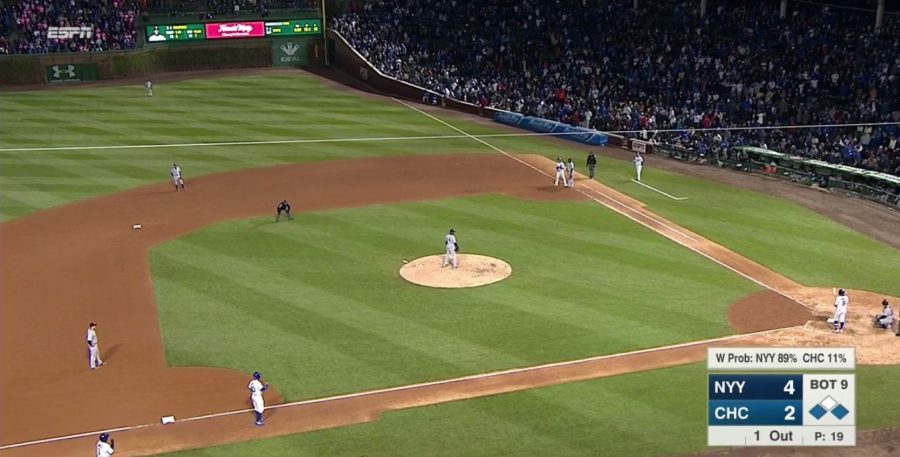
You might have noticed a new addition to the screen on ESPN’s MLB coverage. This season, ESPN added a win probability metric in certain situations to better represent the impact of key moments during the game. It appears as a small graphic atop the score box and shows the percentage chance each team has to win the game given the current situation.
– Phil Orlins on the addition of the win probability metric
ESPN MLB senior coordinating producer Phil Orlins explains that the innovation is another way to keep fans involved in the telecast.
“We want to do things that evoke passion in our viewers. Things they react to and respond to,” Orlins said. “That means they are connecting to it emotionally. We try to avoid indifference.”
The marathon game between the New York Yankees and Chicago Cubs on the May 7 Sunday Night Baseball telecast showcased the value of win probability. The 18-inning, 6-hour, 5-minute battle saw a handful of events dramatically swing the metric one way or the other multiple times.
The Yankees beat the Cubs, 5-4.
Orlins explains how the metric is utilized during a telecast.
ESPN will provide extensive, on-site coverage leading up to Derek Jeter Night at Yankee Stadium this Sunday, May 14 (6:30 p.m. ET) before the New York Yankees host the Houston Astros (7:30). The former star will be celebrated by the team and its fans as his iconic No. 2 jersey is retired and his Monument Park plaque is unveiled.
How did Sunday’s game demonstrate why we use the win probability metric?
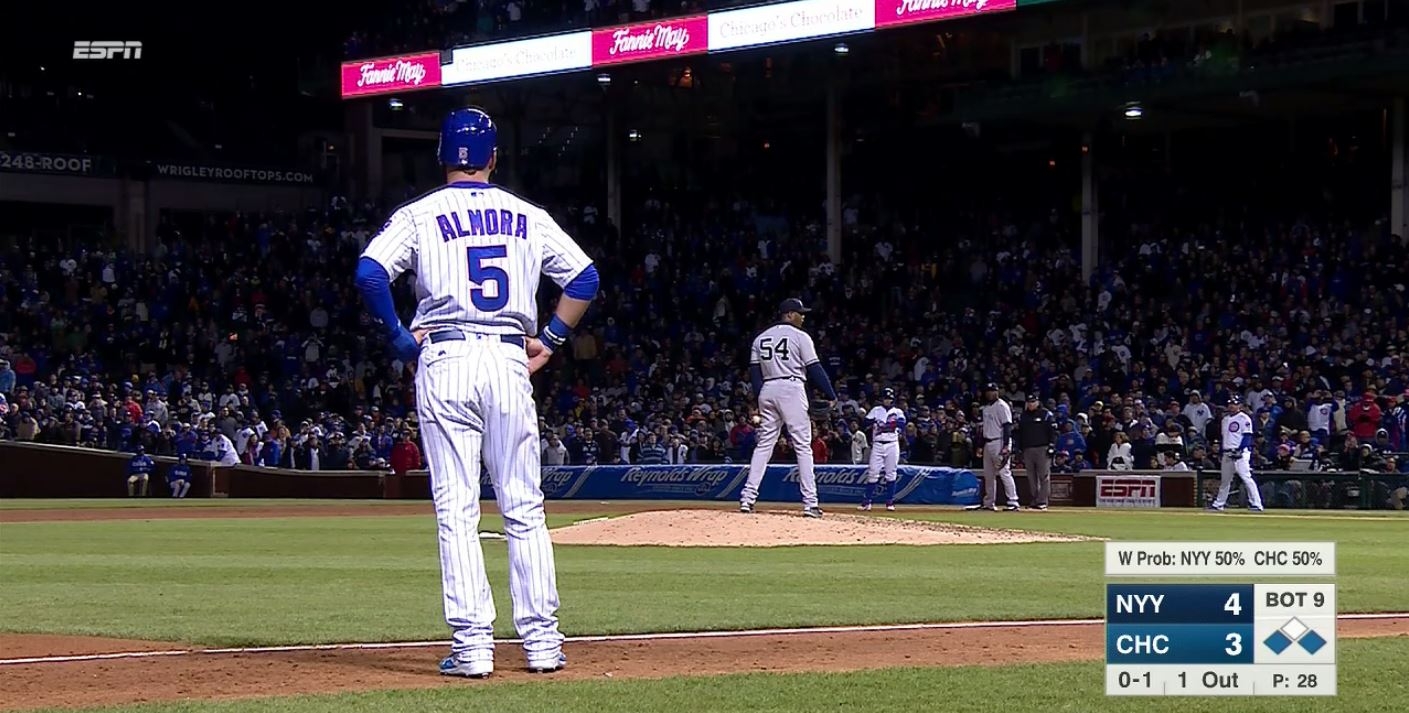
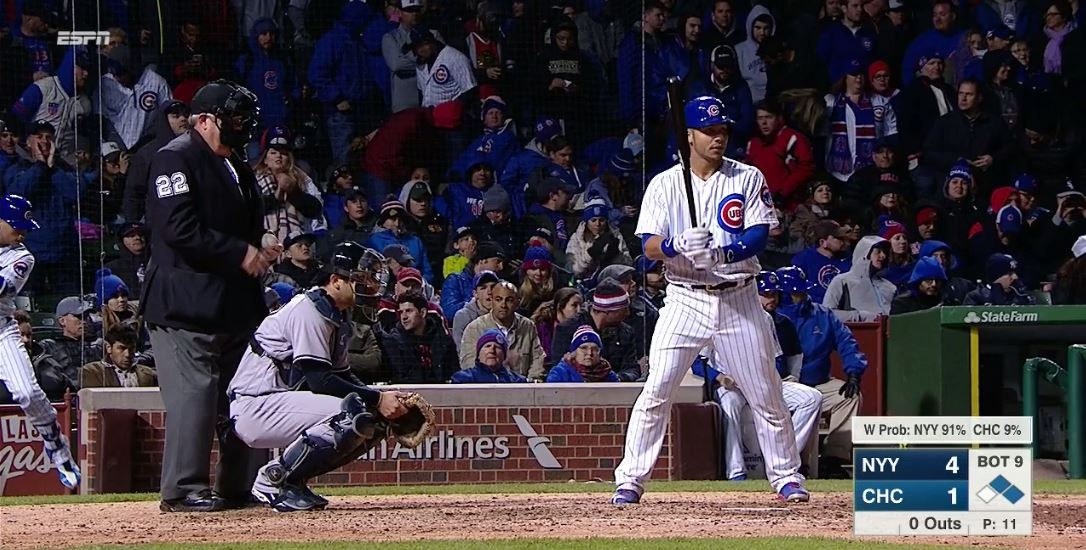
The 18-inning game on Sunday was at around a 95-percent win probability for the Yankees going into the bottom of the ninth inning. It then favored the Cubs after they tied the game.
The Javier Báez hit that brought the tying run to third with one out in the bottom of the ninth moved the probability to 50/50. You’re watching it go from around 95/5 to 90/10 to 88/12 then all of a sudden you get that tying run on third with less than two outs, and you’re at 50/50. That moment is pretty intense if you’re a fan of either team.
When do you feel the metric is most impactful for viewers?
It has a number of impacts. It catches people off guard how much two or three runs in the first few innings mean. An 80-percent chance to win in the third inning might seem odd, but when you think about a sport that gets three or four runs a game, if a team is up 3-0 that’s pretty meaningful. I still think the greatest impact comes in the eighth or ninth innings on key plays.
What’s the process for determining how and when to use the metric on the screen during the game?
We try to use it aggressively and intelligently by feel. We introduce it when significant things happen early in the game. We’ll use it much more regularly as we get through the final plays of the game in a scenario like we had Sunday night. We try to use it, like most things in TV, when we feel it’s going to be compelling in late innings in close games.